
Profiling
You can profile your project to check its runtime performance and find problems. Use the Xenko Game Profiler script or an external profiling tool such as the Performance Profiler in Visual Studio.
The Game Profiler script shows how performance costs change at runtime. This helps isolate bottlenecks and find their cause.
To use the script:
- In the Asset View, click and select Scripts > Game Profiler.
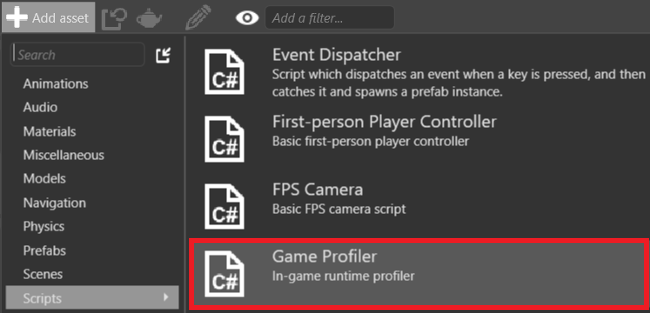
- The New script dialog opens. Leave the default information and click Create script.
Game Studio adds the GameProfiler script to your project.
Add the script to an entity. For instructions, see Use scripts.
Select the entity that contains the GameProfiler.
Tip
You can also enable and disable the profiler at runtime with Left Ctrl + Left Shift + P.
-
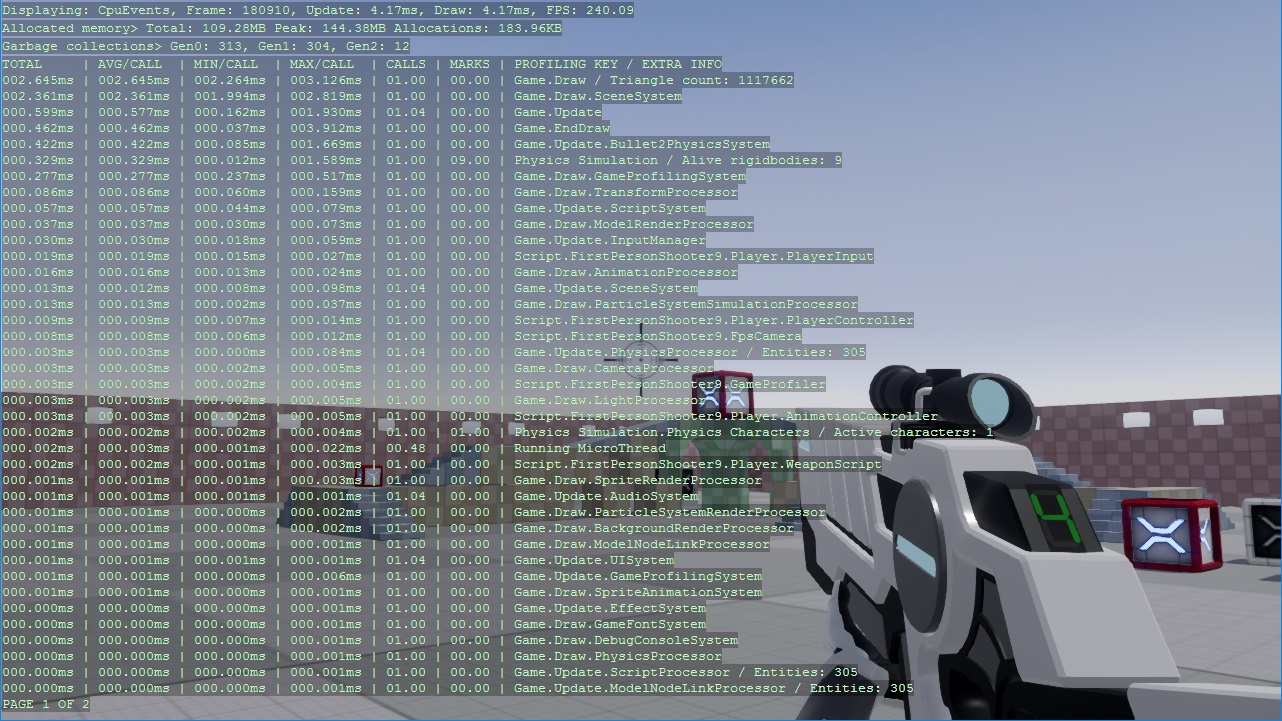
The Game Profiler shows profiling results as your game runs.
Note
Game Profiler disables VSync. This gives you the true profiling values, ignoring sync time.
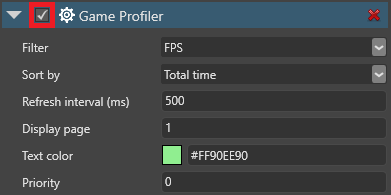
To change the Game Profiler properties, select the GameProfiler entity and use the Property Grid.
The top row displays information about basic performance.

- : the kind of information the profiler displays (FPS only, CPU, or GPU)
Frame: the current frameUpdate: the average time (ms) taken to update the game since the profiler last refreshedDraw: the average time (ms) taken to render the frame since the profiler last refreshedFPS: the average number of frames rendered per secondIf you select CPU as the display mode, the profiler displays:
Total: the amount of memory currently usedPeak: the peak memory use since the game startedAllocations: the amount of memory allocated or freed since the profiler last refreshedGen0, ,Gen1: the number of garbage collections per each generation of object (Gen0is the most recent generation)If you select GPU as the display mode, the profiler displays:

Device: the graphics device (manufacturer's description)Platform: the currently used backend (eg DirectX, OpenGL, Vulkan, etc)Profile: the feature level for your game, set in Game Settings > Rendering (see )Resolution: the game resolutionDrawn triangles: the number of triangles drawn per frameDraw calls: the number of draw calls per frameTexture memory: the amount of memory allocated to texturesIn the GPU and CPU modes, the profiler displays information about the parts of the code being profiled, including active scripts.
Note
Each value describes the events per frame since the last profiler refresh.
You can change the Game Profiler settings at runtime using keyboard shortcuts.
- Enable profiling:
- Enable profiling only for the profiler keys you specify:
- Enable the profiling except for the profiler keys you specify:
- To access the prolifing key of a script, use ProfilingKey.
Instead of using the Xenko Game Profiler, you can use external profiling tools to profile your project.
Visual Studio has powerful in-built profiling tools that can identify common performance issues.
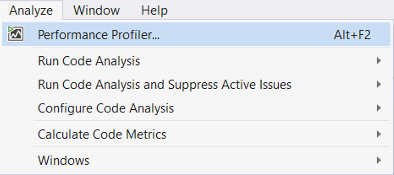
To open the profiler, press Alt + F2, or in the task bar click Analyze > Performance Profiler.
- In the Profiler window, select the profiling tools you want to run.
You can run multiple profiling tools at once.
- To launch the profiler, in the Performance Profiler tab, at the bottom, click Start.
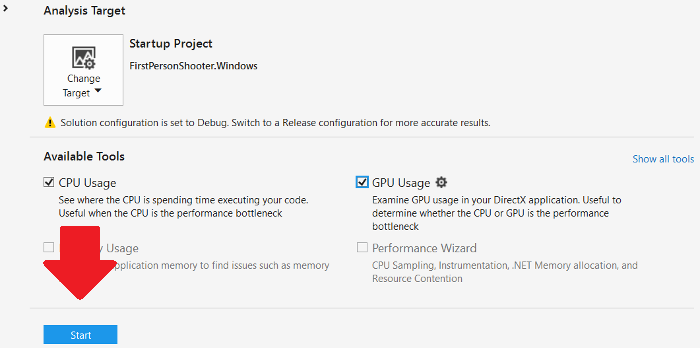
Visual Studio runs your application and begins profiling.
For more information about the Visual Studio profiler, see the .
As CPU and GPU process different types of data, it's usually easy to identify which part is causing a bottleneck.
Most GPU problems arise when the application uses expensive rendering techniques, such as post effects, lighting, shadows, and tessellation. To identify the problem, disable rendering features.
If instead there seems to be a CPU bottleneck, reduce the complexity of the scene.
For graphics:
- decrease the resolution of your game
- reduce the quality of your post effects
- reduce the number of lights and size of
- reduce shadow map sizes
use culling techniques to reduce the number of objects and vertices renderedFor textures:
use compressed textures on slower devices
- use sprite sheets, not individual images

