
In [ ]:
In [ ]:
Path.BASE_PATH = path
We can see what’s in this directory by using ls, a method added by fastai. This method returns an object of a special fastai class called L, which has all the same functionality of Python’s built-in list, plus a lot more. One of its handy features is that, when printed, it displays the count of items, before listing the items themselves (if there are more than 10 items, it just shows the first few):
In [ ]:
path.ls()
Out[ ]:
(#9) [Path('cleaned.csv'),Path('item_list.txt'),Path('trained_model.pkl'),Path('models'),Path('valid'),Path('labels.csv'),Path('export.pkl'),Path('history.csv'),Path('train')]
The MNIST dataset follows a common layout for machine learning datasets: separate folders for the training set and the validation set (and/or test set). Let’s see what’s inside the training set:
In [ ]:
Out[ ]:
(#2) [Path('train/7'),Path('train/3')]
There’s a folder of 3s, and a folder of 7s. In machine learning parlance, we say that “3” and “7” are the labels (or targets) in this dataset. Let’s take a look in one of these folders (using sorted to ensure we all get the same order of files):
threes
Out[ ]:
(#6131) [Path('train/3/10.png'),Path('train/3/10000.png'),Path('train/3/10011.png'),Path('train/3/10031.png'),Path('train/3/10034.png'),Path('train/3/10042.png'),Path('train/3/10052.png'),Path('train/3/1007.png'),Path('train/3/10074.png'),Path('train/3/10091.png')...]
As we might expect, it’s full of image files. Let’s take a look at one now. Here’s an image of a handwritten number 3, taken from the famous MNIST dataset of handwritten numbers:
In [ ]:
Out[ ]:
Here we are using the Image class from the Python Imaging Library (PIL), which is the most widely used Python package for opening, manipulating, and viewing images. Jupyter knows about PIL images, so it displays the image for us automatically.
In a computer, everything is represented as a number. To view the numbers that make up this image, we have to convert it to a NumPy array or a PyTorch tensor. For instance, here’s what a section of the image looks like, converted to a NumPy array:
In [ ]:
array(im3)[4:10,4:10]
Out[ ]:
array([[ 0, 0, 0, 0, 0, 0],[ 0, 0, 0, 0, 0, 29],[ 0, 0, 0, 48, 166, 224],[ 0, 107, 253, 253, 230, 48],[ 0, 3, 20, 20, 15, 0]], dtype=uint8)
In [ ]:
tensor(im3)[4:10,4:10]
Out[ ]:
We can slice the array to pick just the part with the top of the digit in it, and then use a Pandas DataFrame to color-code the values using a gradient, which shows us clearly how the image is created from the pixel values:
In [ ]:
#hide_outputim3_t = tensor(im3)df = pd.DataFrame(im3_t[4:15,4:22])
Out[ ]:
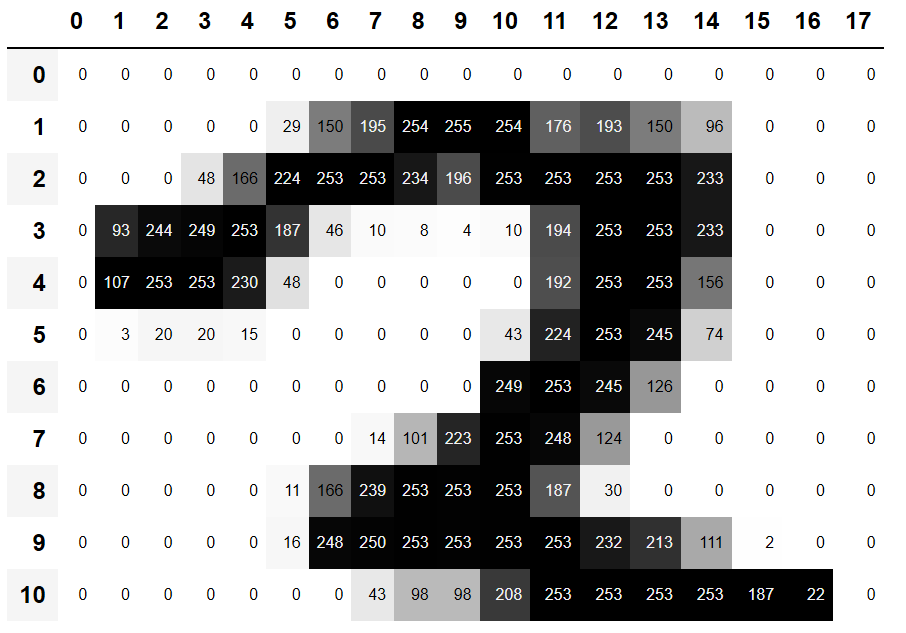
You can see that the background white pixels are stored as the number 0, black is the number 255, and shades of gray are between the two. The entire image contains 28 pixels across and 28 pixels down, for a total of 784 pixels. (This is much smaller than an image that you would get from a phone camera, which has millions of pixels, but is a convenient size for our initial learning and experiments. We will build up to bigger, full-color images soon.)
So, now you’ve seen what an image looks like to a computer, let’s recall our goal: create a model that can recognize 3s and 7s. How might you go about getting a computer to do that?

