
Navigate a Systrace report
Systrace generates an output HTML file that contains a series of sections. Thereport lists the threads of each process. If a given thread renders UI frames,the report also indicates the rendered frames along the timeline. Time passes inthe forward direction as you move left to right across the report.
From top to bottom, the report contains the following sections.
The first section contains bars that represent specific user interactions withinyour app or game, such as tapping on the device's screen. These interactionsserve as useful time markers.
CPU activity
The next section shows bars that represent thread activity within each CPU. Thebars show CPU activity across all apps, including your app or game.
The CPU activity section is expandable, allowing you to view clock frequency foreach CPU. Figure 1 shows an example of a collapsed CPU activity section, andFigure 2 shows an expanded version that displays clock frequency:
Figure 1. Sample CPU activity (collapsed view) in a Systrace report
The histograms in this section show specific system-level events, such astexture counts and the total size of specific objects.
Other histograms depicting the Surface Flinger process, including VSync eventsand UI thread swap work, appear in Figure 3:
Figure 3. Sample Surface Flinger graph in a Systrace reportDisplay frames
This section, often the tallest in the report, depicts a multicolored linefollowed by stacks of bars. These shapes represent the status and frame stack ofa particular thread that's been created. Each level of the stack represents acall to , or the beginning of a that you've defined for your appor game.
Note: The UI thread, or the main thread where your app or game typically runs,always appears as the first thread.
The multicolored line above each stack of bars represents a particular thread'sset of statuses over time. Each segment of the line can contain one of thefollowing colors:
- Green: Running
- The thread is completing work related to a process or is responding to aninterrupt.
- Blue: Runnable
- The thread is available to run but isn't currently scheduled.
- White: Sleeping
- The thread has no work to do, perhaps because the thread is blocked on a mutexlock.
- The thread is blocked on I/O or waiting for a disk operation to complete.
- Purple: Interruptable sleep
- The thread is blocked on another kernel operation, usually memory management.
Note: Within the Systrace report, you can click on the line to determine whichCPU had control of the thread at a given time.
The following table lists the keyboard shortcuts that are available whileviewing a Systrace report:
When interacting with a Systrace report, you can inspect device CPU usage overthe duration of the recording. For help navigating the HTML report, see thekeyboard shortcuts section, or click the ? button inthe top-right corner of the report.
The sections below explain how to inspect information in the report to find andfix performance problems.
When navigating around a Systrace report, you can identify performance concernsmore easily by doing one or more of the following:
- Select a time interval of interest by drawing a rectangle around the timeinterval.
- Mark or highlight a problem area using the ruler tool.
- Show each display refresh operation by clicking View Options > HighlightVSync.
Inspect UI frames and alerts
As shown in Figure 4, a Systrace report lists each process that renders UIframes and indicates each rendered frame along the timeline. Frames that renderwithin the 16.6 milliseconds required to maintain a stable 60 frames per secondare indicated with green frame circles. Frames that take longer than 16.6milliseconds to render are indicated with yellow or red frame circles.
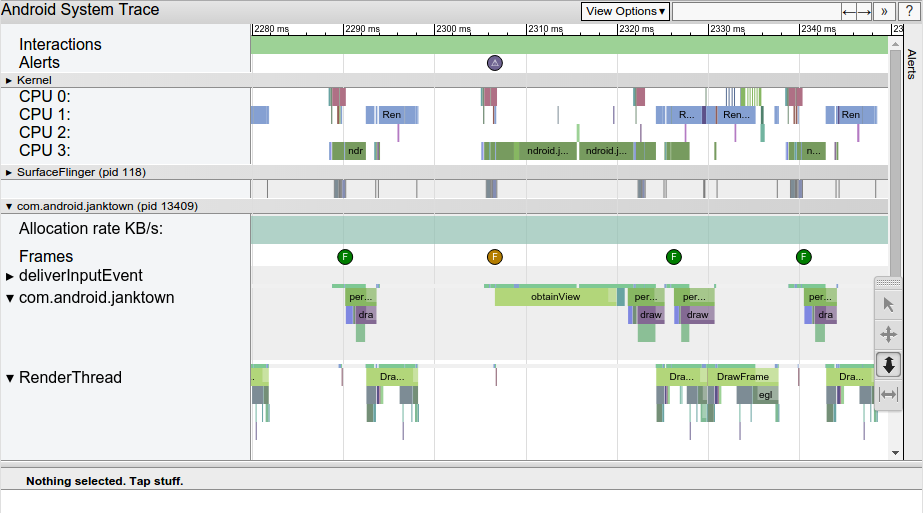
Note: On devices running Android 5.0 (API level 21) or higher, the work ofrendering a frame is split between the UI thread and the render thread. On priorversions, all work in creating a frame is done on the UI thread.
Clicking on a frame circle highlights it and provides additional informationabout the work done by the system to render that frame, including alerts. Thereport also shows you the methods that the system was executing while renderingthat frame. You can investigate those methods to determine potential causes ofUI jank.
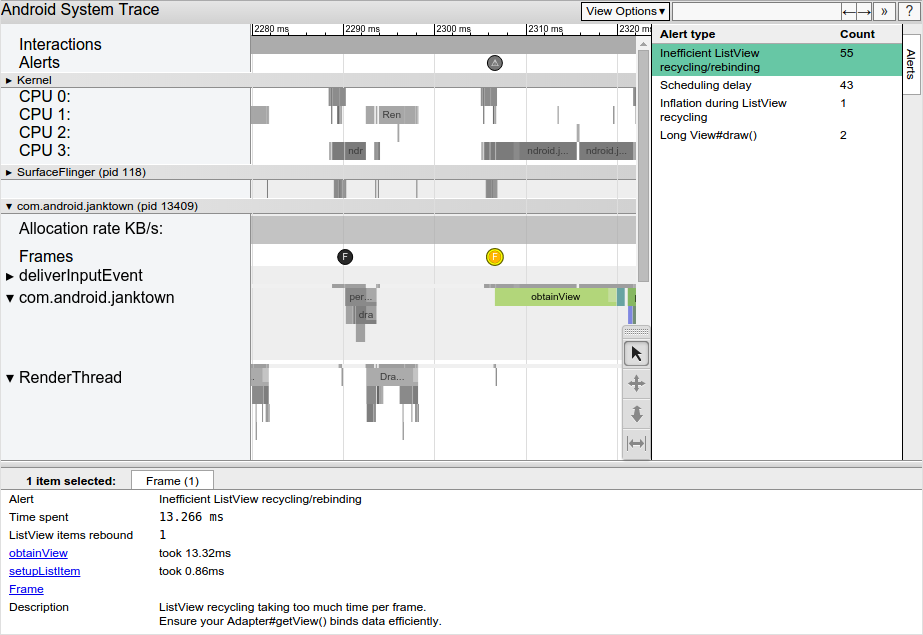
Figure 5. Selecting the problematic frame, an alert appears below the trace report identifying the problemAfter you select a slow frame, you may see an alert in the bottom pane of thereport. The alert shown in Figure 5 calls out that the primary problem with theframe is that too much time is spent inside recycling and rebinding. Thereare links to the relevant events in the trace that explain more about what thesystem is doing during this time.
To see each alert that the tool discovered in your trace, as well as the numberof times that the device triggered each alert, click the Alerts tab atthe far right of the window, as shown in Figure 6. The Alerts panel helpsyou see which problems occur in the trace and how often they contribute to jank.You can think of this panel as a list of bugs to be fixed. Often, a small changeor improvement in one area can remove an entire set of alerts.
If you see too much work being done on the UI thread, use one of the followingapproaches to help determine which methods are consuming too much CPU time:
- If you have an idea as to which methods could be causing bottlenecks, addtrace markers to these methods. To learn more, see the guide on how to definecustom events in your code.

