
Inspect energy use with Energy Profiler
The Energy Profiler monitors the use of the CPU, network radio, and GPS sensor,and it displays a visualization of how much energy each of these componentsuses. The Energy Profiler also shows you occurrences of system events (wakelocks, alarms, jobs, and location requests) that can affect energy consumption.
The Energy Profiler does not directly measure energy consumption. Rather, ituses a model that estimates the energy consumption for each resource on thedevice.
The Energy Profiler appears as a row in of the Profiler window when you runyour app on a connected device or Android Emulator running Android 8.0 (API 26)or higher.
To open the Energy Profiler, follow these steps:
- Select View > Tool Windows > Profiler or click Profile in the toolbar.
If prompted by the Select Deployment Target dialog, choose the device towhich to deploy your app for profiling. If you've connected a device over USBbut don't see it listed, ensure that you have.
- Click anywhere in the Energy timeline to open the Energy Profiler.
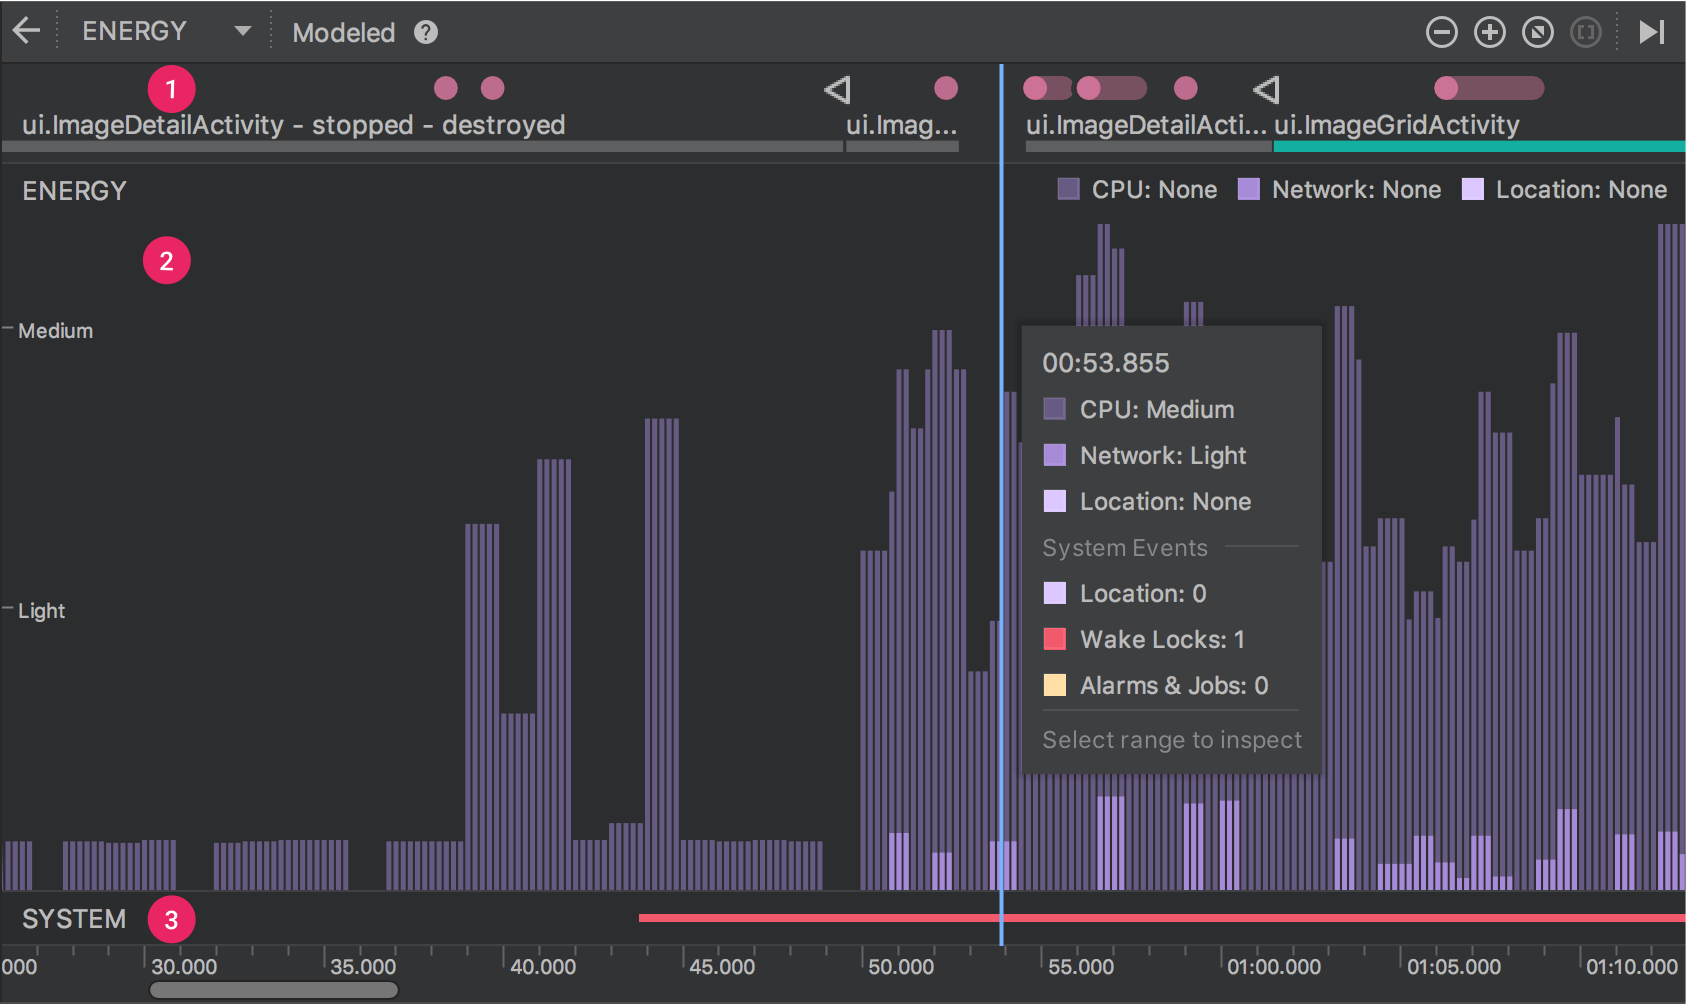
Figure 1. Timelines in the Energy Profiler.
As indicated in figure 1, the default view for the Energy Profiler includes thefollowing timelines:
- Energy timeline: Shows estimated energy consumption of your app.
- System timeline: Indicates system events that may affect energy consumption.
To see a breakdown of energy use by CPU, network, and location (GPS) resources,as well as relevant system events, place your mouse pointer over a bar in the Energy timeline.
Inspect system events: wake locks, jobs, and alarms
You can use the Energy Profiler to find system events that can affect energyconsumption, including wake locks, jobs, and alarms:
A wake lock is a mechanism for keeping theCPU or screen on when the device would otherwise go to sleep. For example, anapp that plays video may use a wake lock to keep the screen on when there isno user interaction with the device. Requesting a wake lock is not anenergy-intensive action, but failing to release a wake lock can cause thescreen or CPU to stay on for longer than necessary, which can drain thebattery quickly. For more information, see the guidance for.
Location requests use the GPS sensor, which can consume significant amounts ofenergy. For information on how to make energy-efficient location requests, seeOptimize location for battery.
The Energy Profiler makes it easy to find where your app uses each of thesefeatures so that you can make informed decisions about how each is used.
The Energy Profiler shows a color-coded bar in the System timeline below theEnergy timeline for the time range when a system event is active. Wake locksare represented with a red bar, jobs and alarms are indicated with a yellow bar,and location events are indicated with a light purple bar.
Figure 2 shows the Energy Profiler and the code editor open to the source coderesponsible for an unreleased wake lock.
Figure 2. Using the Energy Profiler to find a wake lock.
- To open the System Event pane and show details for events such as wake locks, select a time range in the Energy timeline.
- To open the Wake Lock Details pane and show details for a specific wake lock, select the wake lock in the System Event pane.
- To open the code editor and jump to the source code for a wake lock, double-click the entry for the calling method at the top of the call stack in the Wake Lock Details pane.

