
Capture a system trace on a device
It's particularly helpful to record traces when addressing performance-relatedbugs in your app, such as slow startup, slow transitions, or UI jank.
The System Tracing app allows you to record a system trace using a QuickSettings tile or a menu within the app itself. The following sections describehow to complete the recording process using these interfaces.
Note: As part of your development workflow, you might submit an on-device bugreport. It's important to file this type of bug report after you've finishedrecording a system trace. That way, the bug report process itself isn't includedin the recorded trace.
The Quick Settings tile is usually the more convenient way to complete theon-device system tracing process.
Set up tile
Figure 2. The Show Quick Settings tile switch in the System Tracing appIf you're using System Tracing for the first time on your test device, or if youdon't see the System Tracing tile in your device's Quick Settings panel(Figure 1), complete the following setup steps:
- , if you haven'tdone so already.
- Open the Developer Options settings screen.
- In the Debugging section, select System Tracing. The System Tracingapp opens, showing the app menu.
- From the app menu, enable Show Quick Settings tile, as shown in Figure 2.The system adds the System Tracing tile to the Quick Settings panel,which appears in Figure 1:
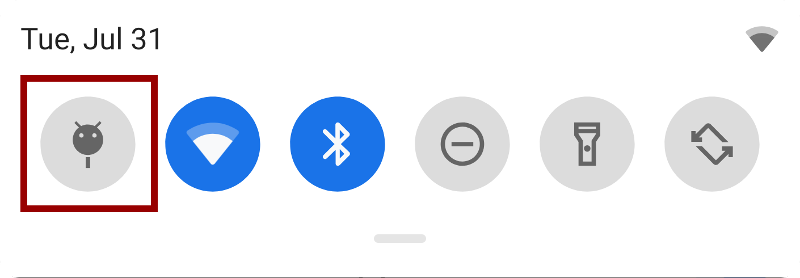
Note: By default, the systemadds the System Tracing tile as the first tile in the QuickSettings panel. If you'd like the tile to appear in a differentposition, use the panel's edit mode to move the tile.
Complete a system trace recording
- Tap the System Tracing tile, which has the label "Record trace". The tilebecomes enabled, and a persistent notification appears to notify you that thesystem is now recording a trace, as shown in Figure 3:
Figure 3. Persistent notification that appears after starting an on-device system trace
- Perform the actions in your app that you'd like the system to inspect.
Note: You can record bugs that are difficult to reproduce by leaving SystemTracing running in the background, then stopping System Tracing soonafter the bug occurs. System Tracing saves a device's activity to a rollingbuffer, which holds 10-30 seconds' worth of events.
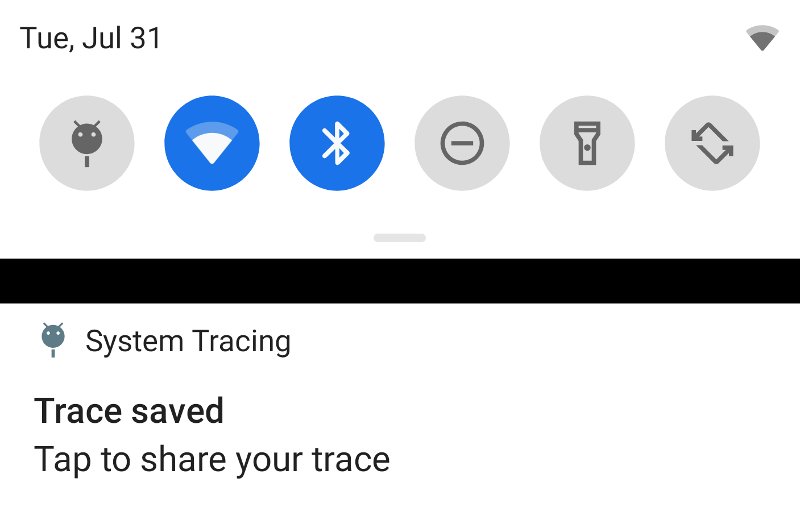
The system displays a new notification that contains the message "Savingtrace". When saving is complete, the system dismisses the notificationand displays a third notification, confirming that your trace has been savedand that you're ready to share the system trace, as shown inFigure 4:
The app menu allows you to configure several advanced settings related to systemtracing and provides a switch for starting and stopping a system trace.
To record a system trace using the System Tracing app menu, complete thefollowing steps:
- , if you haven'tdone so already.
- Open the Developer Options settings screen. In the Debugging section,select System Tracing. The System Tracing app opens.
Alternatively, if you've set up the System Tracing tile,you can long-tap on the tile to enter the System Tracing app.
- Optionally, choose the Categories of system and sensor calls to trace,and choose a Buffer size (in KB). Choose categories that correspond to theuse case that you're testing, such as the Audio category for testingBluetooth operations.
Note: These categories serve as app-level settings, so the system uses thesecategories when , too.In addition, these settings persist across device reboots.
Figure 5. The Record trace switch in the System Tracing app
Perform the actions in your app that you'd like the system to inspect.
Note: You can record bugs that are difficult to reproduce by leaving SystemTracing running in the background, then stopping System Tracing soonafter the bug occurs. System Tracing saves a device's activity to a rollingbuffer, which holds 10-30 seconds' worth of events.
- When you've completed these actions, stop tracing by disabling the Recordtrace switch.
The system displays a new notification that contains the message "Savingtrace". When saving is complete, the system dismisses the notificationand displays a third notification, confirming that your trace has been savedand that you're ready to share the system trace, as shown in.
The System Tracing app helps you share system trace results as part of severaldifferent workflows.
System Tracing allows you to share your collected trace with other apps on yourdevice. In doing so, you can send the trace to your development team through anemail or a bug-tracking app without needing to connect a device to yourdevelopment machine.
After you've recorded a system trace, tap on the notification that appears onthe device (see Figure 4). The platform's intent pickerappears, allowing you to share your trace using the messaging app of yourchoice.
If desired, you can also extract a system trace from a device using ADB. Connectthe device that recorded the trace to your development machine, then run thefollowing commands in a terminal window:
When sharing your trace through a message or through ADB, the report itselfresides in a file. Using this file, you can generate an HTML report ofthe trace. To do so, run the following commands in a terminal window:
- cd /path-to-traces-on-my-dev-machine && \
If you don't already have the command-line program, you can downloadit from the project on GitHub, or directly from the Android Open SourceProject.

