
Grafana support for Prometheus
The following shows an example Grafana dashboard which queries Prometheus for data:
To install Grafana see the official Grafana documentation.
Using
To create a Prometheus data source in Grafana:
- Click on “Data Sources”.
- Click on “Add data source”.
- Select “Prometheus” as the type.
- Set the appropriate Prometheus server URL (for example, )
- Adjust other data source settings as desired (for example, choosing the right Access method).
The following shows an example data source configuration:
- Click the graph title, then click “Edit”.
- Under the “Metrics” tab, select your Prometheus data source (bottom right).
- Enter any Prometheus expression into the “Query” field, while using the “Metric” field to lookup metrics via autocompletion.
- To format the legend names of time series, use the “Legend format” input. For example, to show only the and labels of a returned query result, separated by a dash, you could use the legend format string .
- Tune other graph settings until you have a working graph.
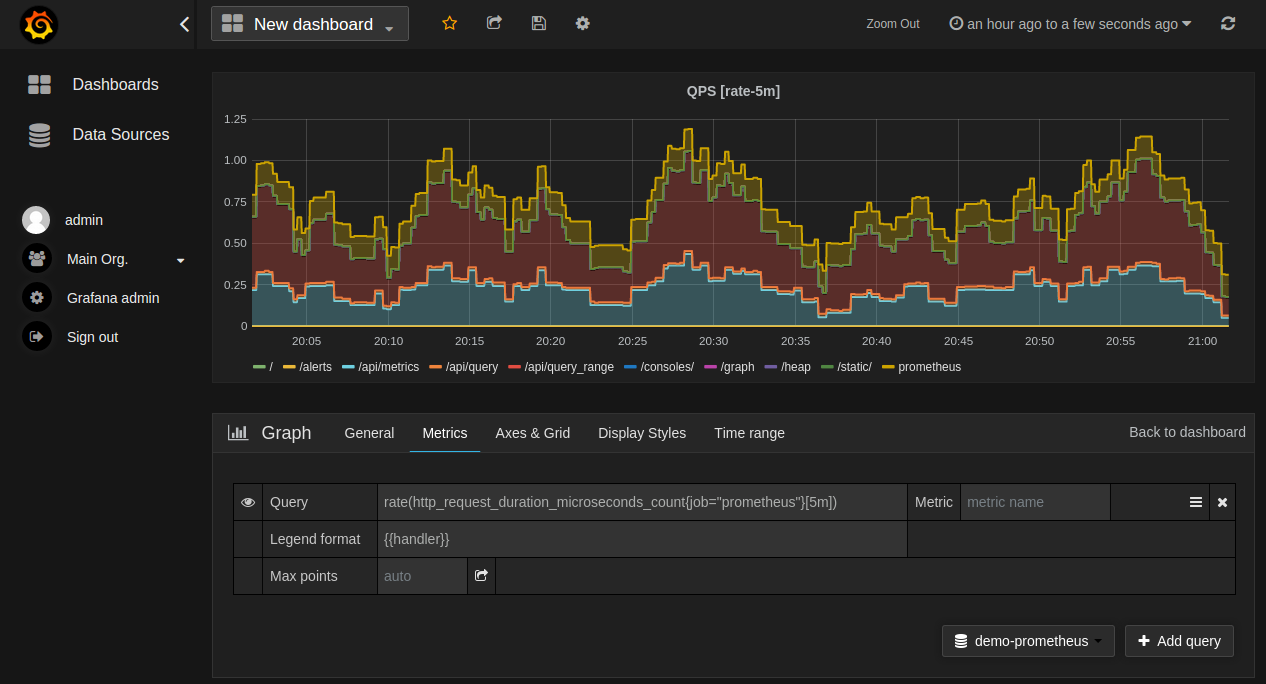
The following shows an example Prometheus graph configuration:
Grafana.com maintains which can be downloaded and used with standalone instances of Grafana. Use the Grafana.com “Filter” option to browse dashboards for the “Prometheus” data source only.
You must currently manually edit the downloaded JSON files and correct the entries to reflect the Grafana data source name which you chose for your Prometheus server. Use the “Dashboards” → “Home” → “Import” option to import the edited dashboard file into your Grafana install.

