Working with Multidimensional Coordinates
Many datasets have physical coordinates which differ from theirlogical coordinates. Xarray provides several ways to plot and analyzesuch datasets.
As an example, consider this dataset from thexarray-data repository.
- In [7]: ds = xr.tutorial.open_dataset('rasm').load()
- In [8]: ds
- Out[8]:
- <xarray.Dataset>
- Dimensions: (time: 36, x: 275, y: 205)
- Coordinates:
- * time (time) object 1980-09-16 12:00:00 ... 1983-08-17 00:00:00
- xc (y, x) float64 189.2 189.4 189.6 189.7 ... 17.65 17.4 17.15 16.91
- yc (y, x) float64 16.53 16.78 17.02 17.27 ... 28.26 28.01 27.76 27.51
- Dimensions without coordinates: x, y
- Tair (time, y, x) float64 nan nan nan nan nan ... 29.8 28.66 28.19 28.21
- Attributes:
- title: /workspace/jhamman/processed/R1002RBRxaaa01a/l...
- institution: U.W.
- source: RACM R1002RBRxaaa01a
- output_frequency: daily
- output_mode: averaged
- convention: CF-1.4
- references: Based on the initial model of Liang et al., 19...
- comment: Output from the Variable Infiltration Capacity...
- nco_openmp_thread_number: 1
- NCO: "4.6.0"
- history: Tue Dec 27 14:15:22 2016: ncatted -a dimension...
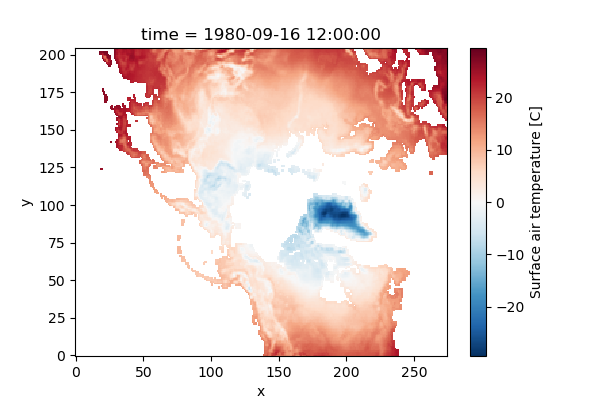
Let’s examine these coordinate variables by plotting them.
- In [12]: ds.xc.plot(ax=ax1);
- In [13]: ds.yc.plot(ax=ax2);
Note that the variables (longitude) and yc (latitude) aretwo-dimensional scalar fields.
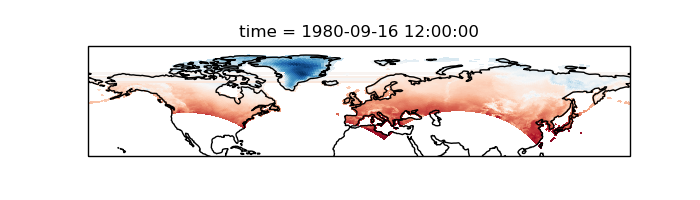
 In order to visualize the data on a conventional latitude-longitudegrid, we can take advantage of xarray’s ability to apply map projections.
- In [15]: plt.figure(figsize=(7,2));
- In [16]: ax = plt.axes(projection=ccrs.PlateCarree());
- In [17]: ds.Tair[0].plot.pcolormesh(ax=ax, transform=ccrs.PlateCarree(),
- ....: x='xc', y='yc', add_colorbar=False);
- ....:
- In [18]: ax.coastlines();
Multidimensional Groupby
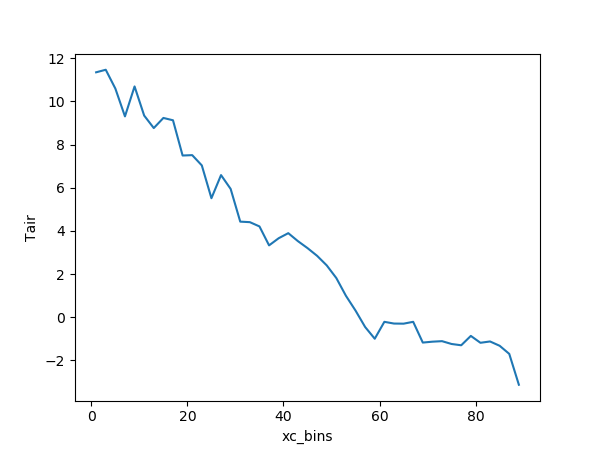 Note that the resulting coordinate for the
 groupby_bins operationgot the _bins suffix appended: . This help us distinguishit from the original multidimensional variable xc.
