
验证集群运行状态
在部署完一套 TiDB 集群后,需要检查集群是否正常运行。本文介绍如何通过 TiUP 命令、TiDB Dashboard 和 Grafana 检查集群状态,以及如何登录 TiDB 数据库执行简单的 SQL 操作。
检查集群状态的命令是 ,例如:
预期结果输出:各节点 Status 状态信息为 Up 说明集群状态正常。
本节介绍如何通过 和 Grafana 检查集群状态。
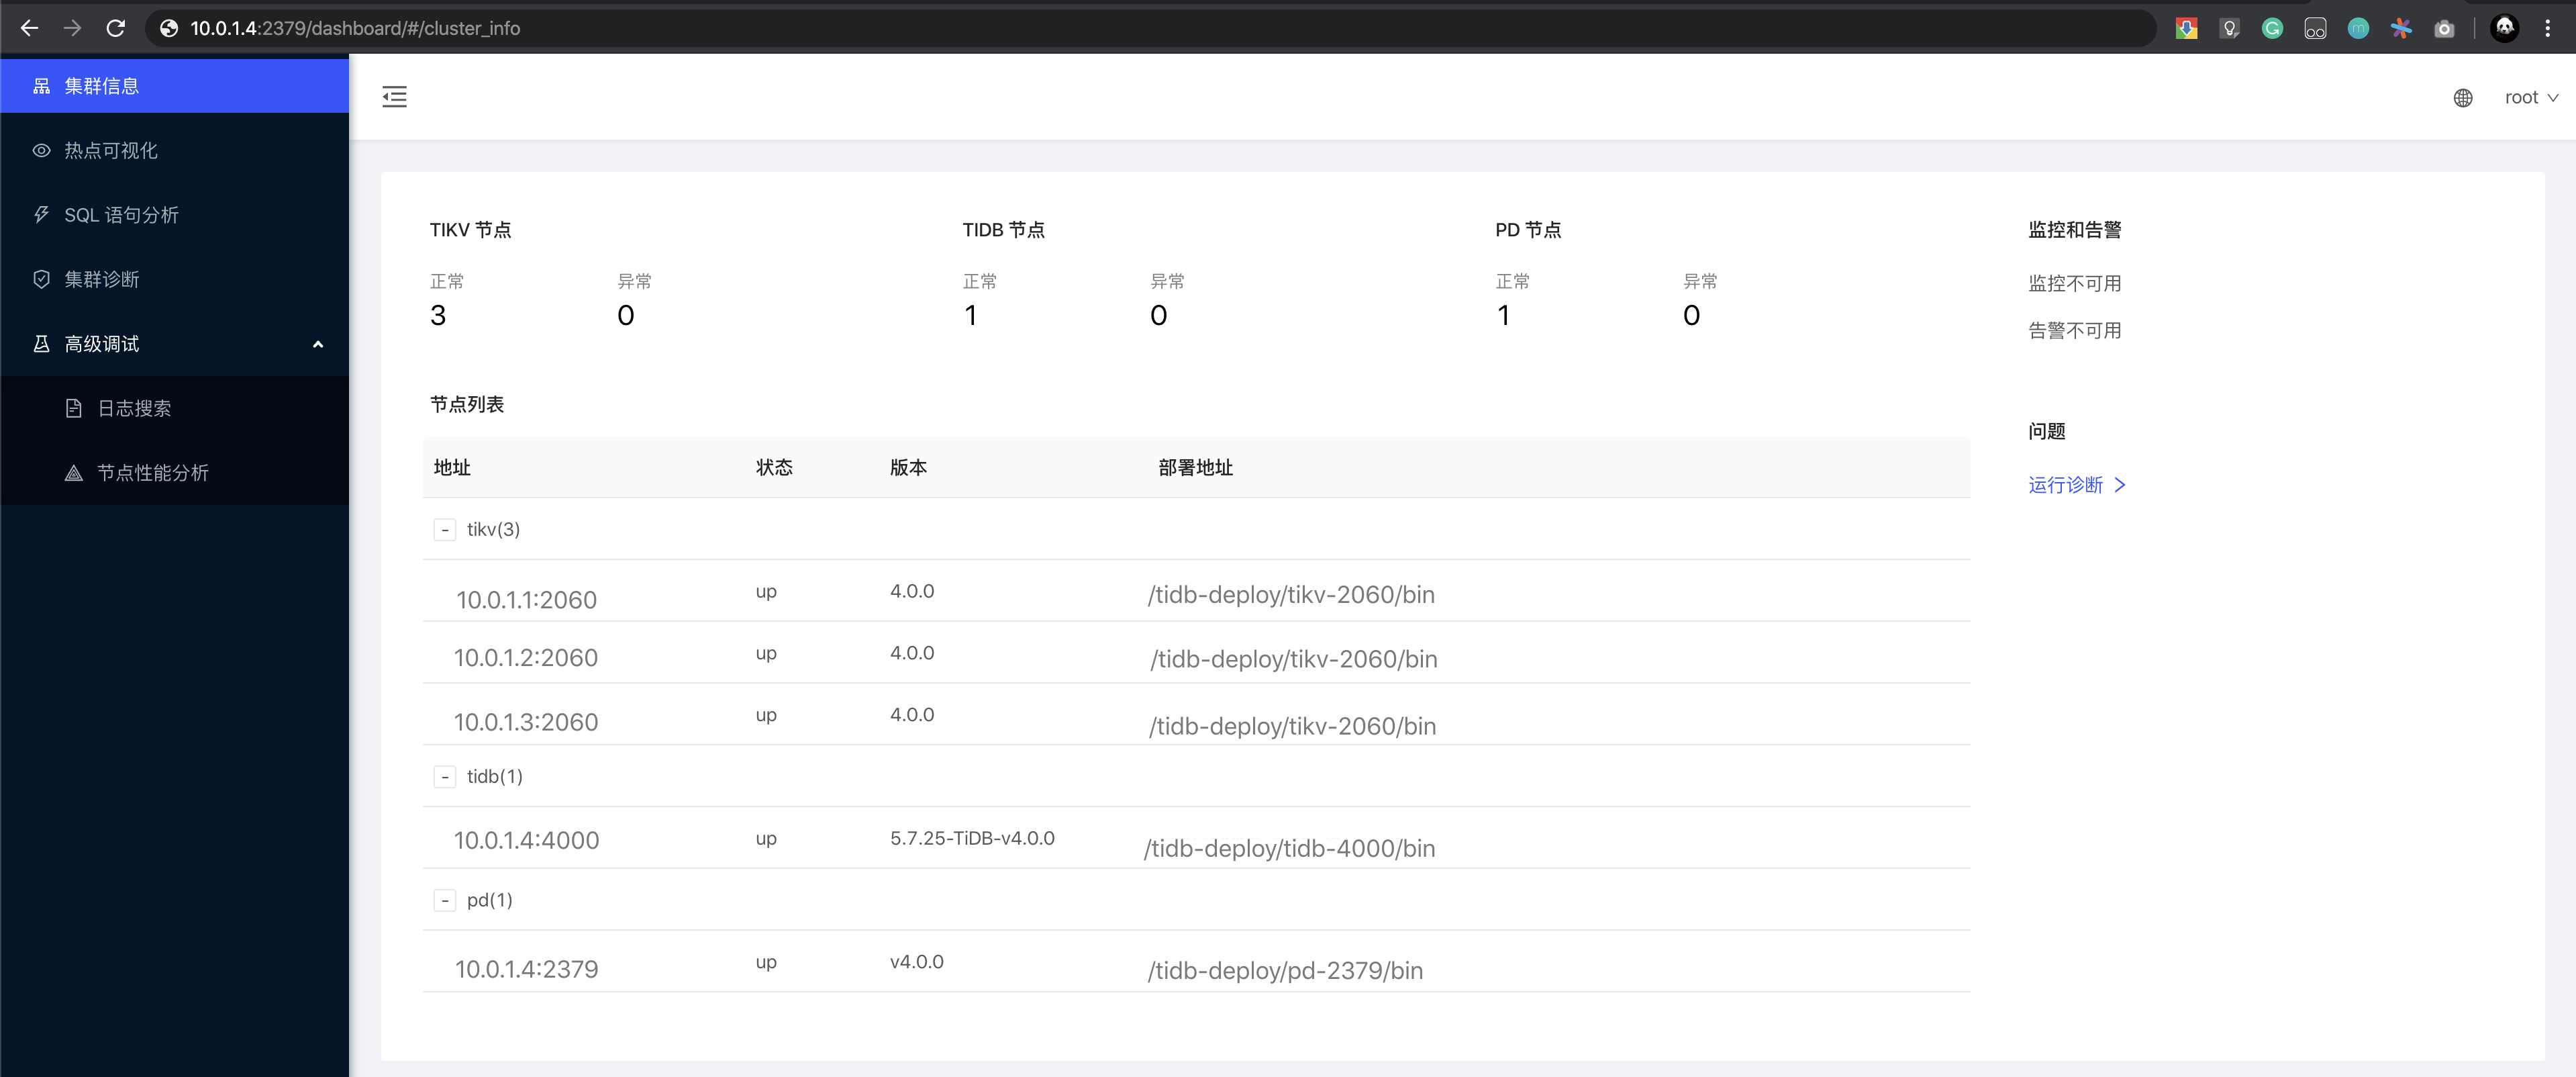
通过
{pd-ip}:{pd-port}/dashboard登录 TiDB Dashboard,登录用户和口令为 TiDB 数据库root用户和口令。如果你修改过数据库的root密码,则以修改后的密码为准,默认密码为空。主页面显示 TiDB 集群中节点信息
通过
{Grafana-ip}:3000登录 Grafana 监控,默认用户名及密码为admin/admin。-
执行如下命令登录数据库:
mysql -u root -h 10.0.1.4 -P 4000
输出下列信息表示登录成功:
Welcome to the MySQL monitor. Commands end with ; or \g.Your MySQL connection id is 3Server version: 5.7.25-TiDB-v4.0.0 TiDB Server (Apache License 2.0) Community Edition, MySQL 5.7 compatibleCopyright (c) 2000, 2015, Oracle and/or its affiliates. All rights reserved.Oracle is a registered trademark of Oracle Corporation and/or itsaffiliates. Other names may be trademarks of their respectiveowners.Type 'help;' or '\h' for help. Type '\c' to clear the current input statement.
创建 PingCAP database
create database pingcap;
use pingcap;
预期输出
Database changed
-
CREATE TABLE `tab_tidb` (`id` int(11) NOT NULL AUTO_INCREMENT,`name` varchar(20) NOT NULL DEFAULT '',`age` int(11) NOT NULL DEFAULT 0,`version` varchar(20) NOT NULL DEFAULT '',PRIMARY KEY (`id`),
预期输出
Query OK, 0 rows affected (0.11 sec)
插入数据
insert into `tab_tidb` values (1,'TiDB',5,'TiDB-v4.0.0');
预期输出
查看
tab_tidb结果select * from tab_tidb;
预期输出
+----+------+-----+-------------+| id | name | age | version |+----+------+-----+-------------+| 1 | TiDB | 5 | TiDB-v4.0.0 |+----+------+-----+-------------+1 row in set (0.00 sec)
查看 TiKV store 状态、
store_id、存储情况以及启动时间select STORE_ID,ADDRESS,STORE_STATE,STORE_STATE_NAME,CAPACITY,AVAILABLE,UPTIME from INFORMATION_SCHEMA.TIKV_STORE_STATUS;
预期输出
+----------+--------------------+-------------+------------------+----------+-----------+--------------------+| STORE_ID | ADDRESS | STORE_STATE | STORE_STATE_NAME | CAPACITY | AVAILABLE | UPTIME |+----------+--------------------+-------------+------------------+----------+-----------+--------------------+| 1 | 10.0.1.1:20160 | 0 | Up | 49.98GiB | 46.3GiB | 5h21m52.474864026s || 4 | 10.0.1.2:20160 | 0 | Up | 49.98GiB | 46.32GiB | 5h21m52.522669177s || 5 | 10.0.1.3:20160 | 0 | Up | 49.98GiB | 45.44GiB | 5h21m52.713660541s |+----------+--------------------+-------------+------------------+----------+-----------+--------------------+3 rows in set (0.00 sec)
退出
预期输出

